Bitcoin statistics and trends: Australia edition
Bitcoin price (and how is it determined?)
If you shop around, you will notice that there are multiple buy/sell prices for Bitcoin available on different exchanges.
Within 24 hours, hundreds of price fluctuations in Bitcoin take place, and this volatility is driven by demand and supply. This demand and supply are how the markets determine a price for Bitcoin at any given time.
Cryptocurrency exchanges help facilitate the buying and selling of Bitcoin and add their service fee on top of the market price of Bitcoin.
What happened to Bitcoin in 2016?
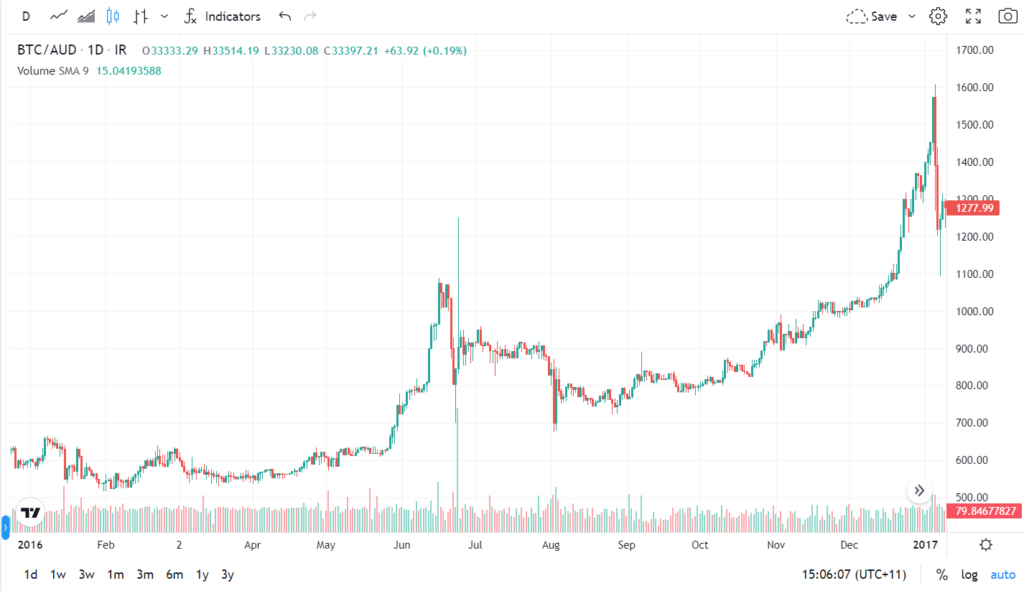
Figure 2: Bitcoin price (AUD) graphed over a twelve-month period (via Independent Reserve).
The lowest price of Bitcoin in 2015, $525.05, occurred on February 16, 2016.
The highest price of Bitcoin in 2015, $1,369, occurred on December 28, 2016.
In June 2016, Bitcoin experienced a mid-year rally, peaking at $1,250.
What happened to Bitcoin in 2017?
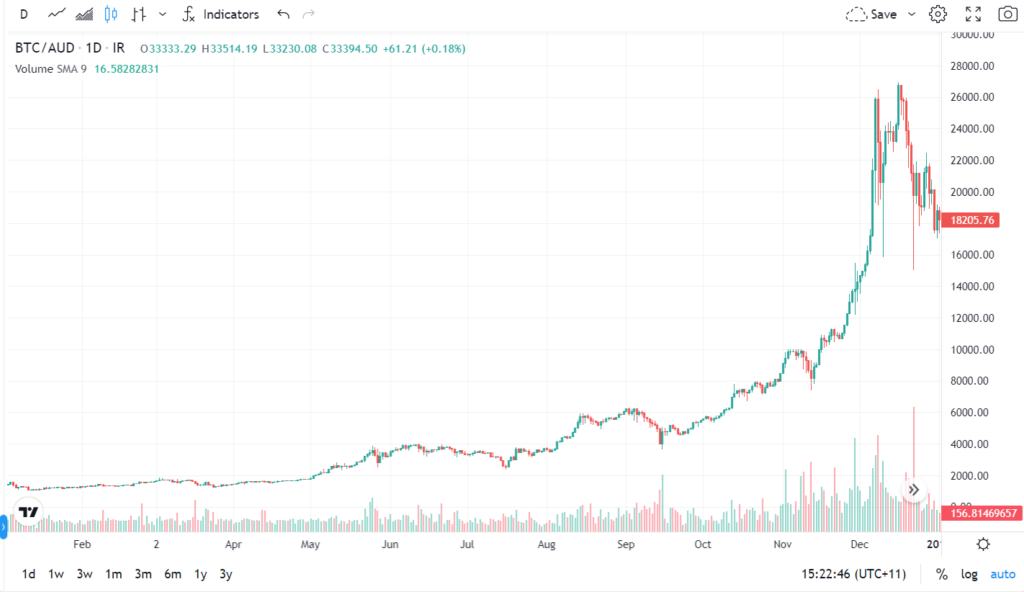
Figure 3: Bitcoin price (AUD) over against a twelve-month period (via Independent Reserve).
The price of Bitcoin was at its lowest, $1,025, on January 12, 2017.
The price of Bitcoin reached its peak of $26,932 on December 16, 2017.
What happened to Bitcoin in 2018?
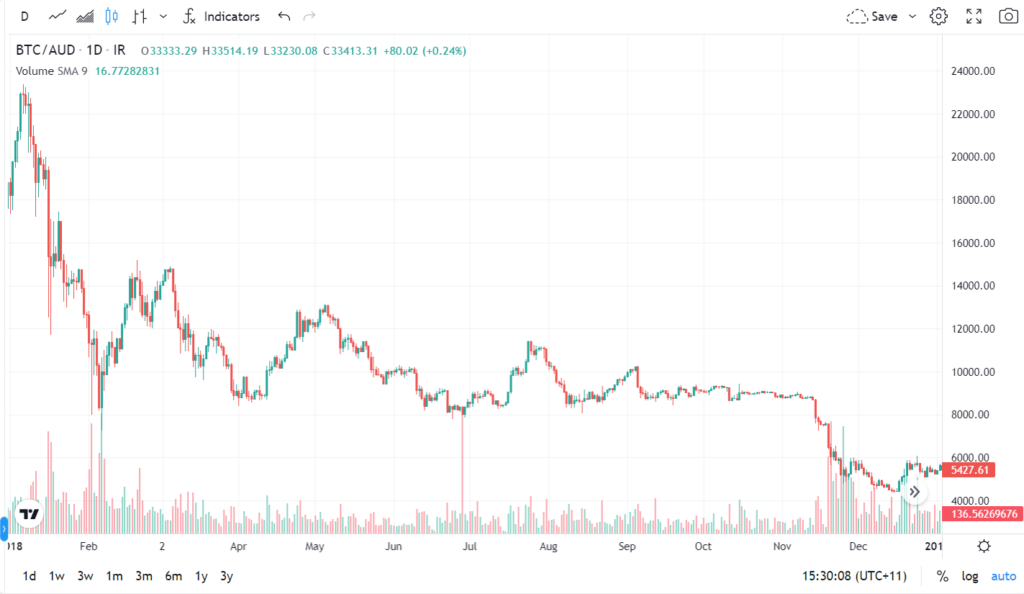
Figure 4: Bitcoin price (AUD) graphed over a twelve-month period (via Independent Reserve).
The price of Bitcoin was its highest at the beginning of the year, $23,369, on January 6, 2018.
Throughout the year, the Bitcoin price continued on a downward trend, finally bottoming out on December 15, 2018, at $4,361.
If you had bought and held Bitcoin at its peak price in 2015, you would have still been ahead had you sold your Bitcoin at the lowest Bitcoin price in 2018.
What happened to Bitcoin in 2019?
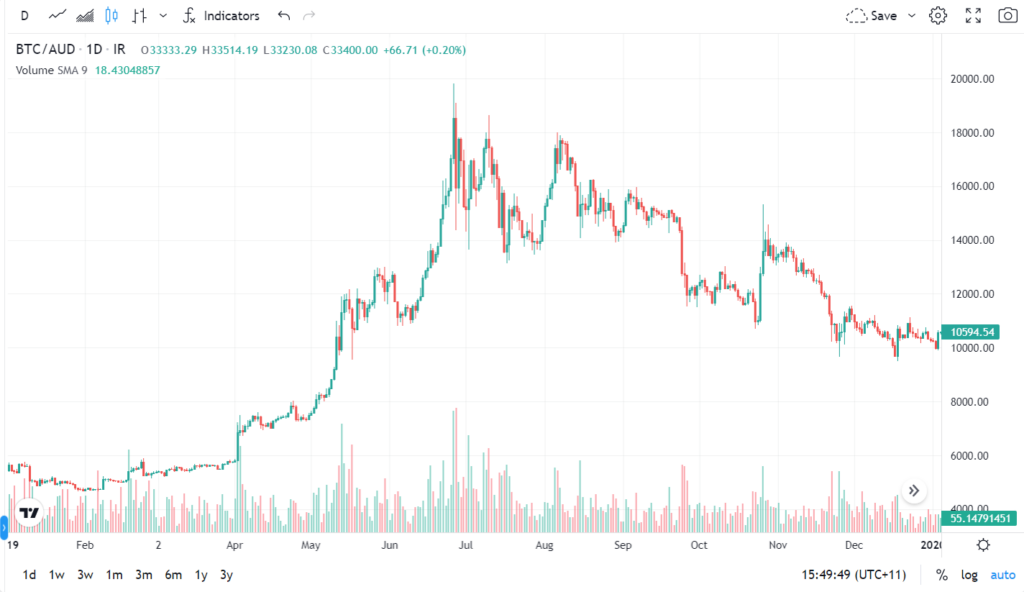
Figure 5: Bitcoin price (AUD) graphed over a twelve-month period (via Independent Reserve).
As the chart above shows, Bitcon price rallied towards the end of April 2019 and reached its peak on June 26, 2019 with a price of $19,809, a far cry from the lowest point on February 6, 2019, $4,654.
What happened to Bitcoin in 2020?

Figure 6: Bitcoin price (AUD) graphed over a twelve-month period (via Independent Reserve).
In 2020, the global economy faced unprecedented challenges as the COVID-19 pandemic prompted widespread shutdowns. Bitcoin entered the year trading at $11,157, but economic uncertainty and investor concerns about government policies fuelled a dramatic rise. By November 23, Bitcoin was trading at $28,641, and it closed the year at $45,172—a staggering 416% increase from its January price.
What happened to Bitcoin in 2021?

Figure 7: Bitcoin price (AUD) graphed over a twelve-month period (via Independent Reserve).
Bitcoin wasted no time in 2021, surpassing its 2020 price record and climbing above $62,321 by January 7. By mid-April, strong institutional interest drove prices to new all-time highs, with Bitcoin peaking at $101,109 on April 14, 2021.
What happened to Bitcoin in 2022?

Figure 8: Bitcoin price (AUD) graphed over a twelve-month period (via Independent Reserve).
Between January and May 2022, Bitcoin’s price steadily declined, closing at $73,943 by late March before dropping to $45,183 on May 11—the first time it had closed below $46,741 since July 2021. The market took a sharper downturn on June 13, with Bitcoin falling below $35,835, a level not seen since December 2020. By the end of 2022, Bitcoin had dipped further, finishing the year under $31,160.
What happened to Bitcoin in 2023?

Figure 9: Bitcoin price (AUD) graphed over a twelve-month period (via Independent Reserve).
Bitcoin opened the year at a price of $25,754. It rose consistently throughout 2023, ending the year at $65,839.
What happened to Bitcoin 2024?
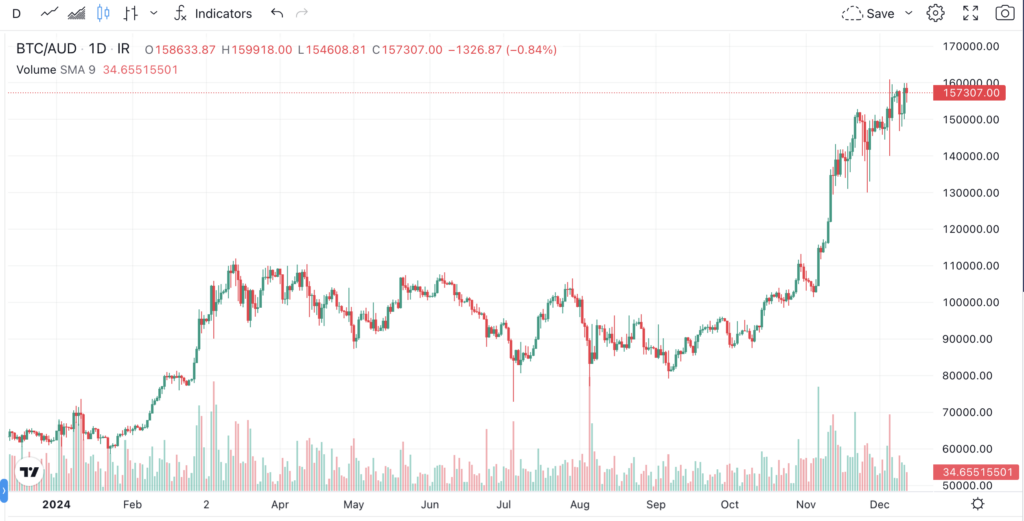
Figure 10: Bitcoin price (AUD) graphed over a twelve-month period (via Independent Reserve).
On 8 November, Bitcoin soared to a new all-time high of $118,650 following Donald Trump’s re-election as U.S. President, closing the day at $116,840—a roughly 9% rise from its close on 6 November.
On 11 November, Bitcoin hit another milestone, surpassing $123,900 on some platforms. The rally continued, and by the morning of 13 November, it reached $140,550.
Momentum remained strong in the following weeks, with Bitcoin hitting staggering highs of $153,780 on Oanda and $153,670 on Gemini by midday 23 November. Around 7 a.m. AEDT, Bitcoin broke the $154,500 barrier on European exchange Whitebit, before closing the day at $153,360.
On 5 December, Bitcoin passed its all-time high milestone of US$100,000 (around $155,804), an incredible surge past its lowest price of $61,553 on January 22 – a gain of about 147% for the year.
The likely factors influencing this massive price increase have included the Bitcoin halving event, the election of pro-crypto US President Trump, and increases in institutional buying of Bitcoin throughout the year—particularly by MicroStrategy and via ETF options.
These incredible milestones showcased unwavering market enthusiasm and Bitcoin’s ability to push into uncharted territory.
Chart from 2014 to 2024

Figure 11: Bitcoin price (AUD) graphed over a 10 year period (via CoinGecko).
Over the past 10 years, Bitcoin’s price has experienced both highs and lows. This chart provides a clear snapshot of those fluctuations in one concise view. While Bitcoin is currently surging like never before, it’s essential to keep in mind that dips are part of the journey. Remember, past performance is not a reliable indicator of future results, and like any investment, Bitcoin carries risks.
Further reading
For further reading, check out our other resources below: