Bitcoin technical analysis

What is technical analysis?
Ever wonder how traders figure out if Bitcoin’s on the rise or set for a dip? Bitcoin technical analysis is the tool they use. By studying price charts and past market data, they try to spot patterns that could reveal the next big move. For example, you might spot a market dip and decide it’s a good time to buy, or catch an early upward trend and ride the wave.
While using technical analysis to buy or sell Bitcoin can be risky for short-term trades, it’s a helpful tool for understanding long-term crypto price cycles, which can support smarter investment decisions.
Bullish versus bearish

You may have heard “Bullish” or “Bearish” before —but what do they really mean? Simply put, “bullish” signals rising markets, while “bearish” indicates ongoing declines. The terms are said to come from how a bull attacks with an upward thrust of its horns and a bear swipes downward with its paws. So, if you read that the crypto market is currently bullish, prices are rising and investor optimism appears to be high.
The candlestick chart
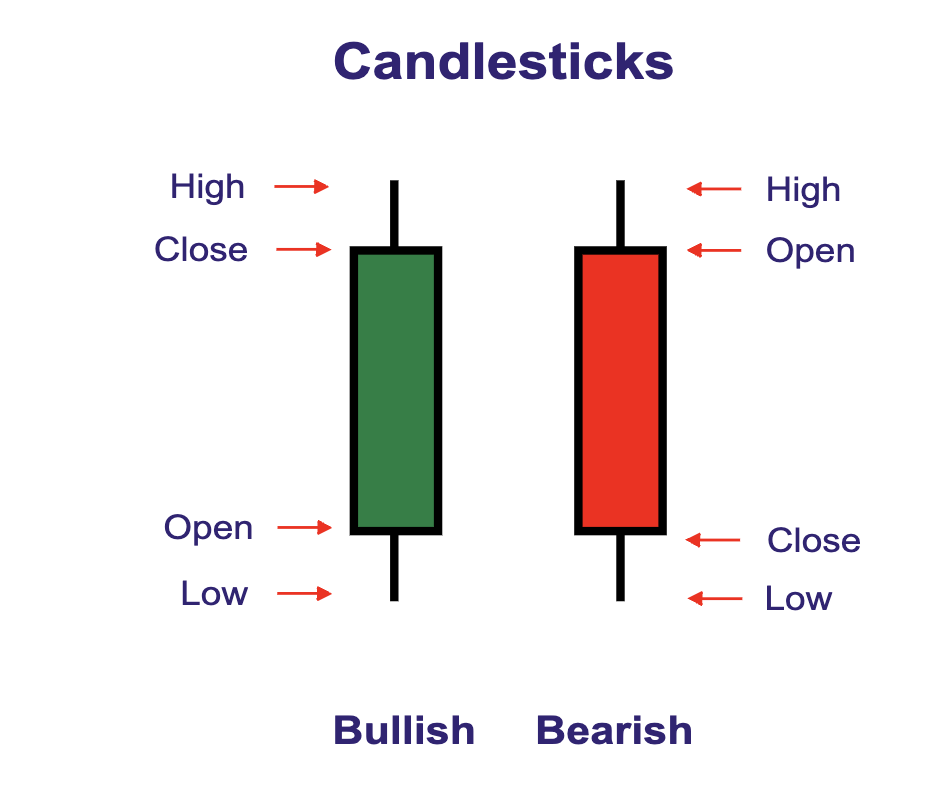
Closely connected to bullish and bearish analysis is the candlestick chart, which helps traders see at a glance whether the market is trending downwards (bearish) or upwards (bullish). Candlestick charts depict financial data in a clear and visually appealing way.
- Each “candle” represents a day of trading.
- A green or filled candle = prices are going up (Bullish).
- A red or hollow candle = prices are dropping (Bearish).
The image below shows how each “candle” represents a day of trading. The candle body (rectangle) represents the price range between the open and close of that day’s trading (which for crypto is a 24-hour day), with the wick (lines on either end) showing the low and high prices for that day. To explore these patterns further, explore Incredible Charts.
What other charts should I use for technical analysis?
Candlestick charts are not the only charts available. For more simplified interactive price charts, bitcoin.com.au is a great place to start. For live Bitcoin prices, sign in to your free bitcoin.com.au account via our mobile app or your browser. From there, navigate to the “Coins” tab to see current price movements on our interactive market tracker. You’ll find real-time price movements and insights across a range of cryptocurrencies, not just Bitcoin.
Of course, there are a lot of other great interactive price charts out there, too, such as on:
We also have a more in-depth blog on key crypto indicators.
To sum up
Technical analysis is a powerful tool for understanding market trends, especially when combined with the real-world context of events. Navigating Bitcoin’s ups and downs can feel overwhelming, but with bitcoin.com.au’s tools and insights, you’ve got a partner in your crypto journey.
Sign up and subscribe to our market update today to stay ahead of the curve.