
In this blog post we will delve into the Bitcoin Rainbow chart as an incredible visualisation tool. We’ll examine its roots, and provide guidance on how it can be utilised to make more informed decisions when buying Bitcoin. Let’s dive in!
Short Summary
- The Bitcoin Rainbow Chart is an informative way to observe the price of BTC, but should not be taken as investment advice.
- It can help traders identify buy/sell opportunities and monitor market sentiment, but has limitations such as relying on historical data.
- To be used effectively, the Bitcoin Rainbow chart should be combined with other analysis tools & indicators to avoid over-reliance on the chart.
Contents
- The Essence of the Bitcoin Rainbow Chart
- The Evolution of the Bitcoin Rainbow Chart
- Using the Bitcoin Rainbow Chart for Trading Decisions
- Limitations and Criticisms of the Bitcoin Rainbow Chart
- Exploring Other Crypto Rainbow Charts
- Summary
- Frequently Asked Questions
The essence of the Bitcoin Rainbow Chart
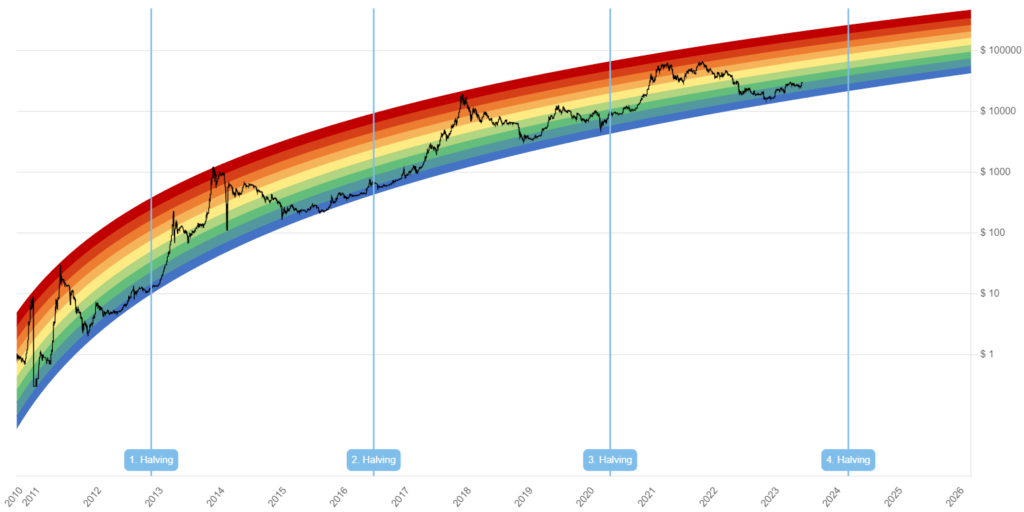
The Bitcoin Rainbow Chart is an engaging and informative way to illustrate the price of Bitcoin. It layers rainbow-colored bands over a logarithmic growth curve channel in order to showcase distinct prices ranges as well as market sentiment. The chart can be a helpful marker for traders looking into recognising the overall upward trend of Bitcoin’s value.
Although the chart provide interesting insights about development patterns visually, it is strictly meant for educational purposes.
Logarithmic growth curve channel
The logarithmic growth curve channel is a core feature of the Bitcoin Rainbow Chart. This mathematical model considers how slower rates of increase occur as its price rises. By using a logarithmic growth curve, the chart serves to display potential future pricing and investor sentiment.
In short, it allows traders to perceive longer-term fluctuations in Bitcoin’s value taking into account aspects such as market cycles and prior performance. As such, investors looking to gain advantage from prospective values can use the graph’s data as a guide for when to buy or sell.
Colour bands and market sentiment
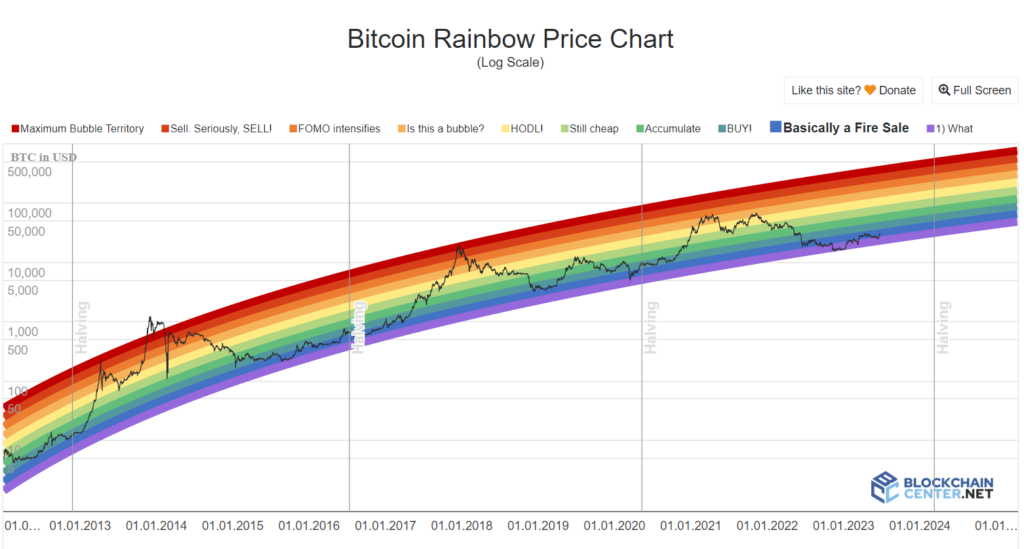
The Bitcoin Rainbow Chart has seven coloured bands that signify different price ranges. By looking at the current band and its colour, traders can gain insight into overall market sentiment in order to make informed decisions when trading this relatively new asset class. For instance, if it moves towards cooler colors on the chart, then investors might look to increase their holding of Bitcoin as prices will likely remain steady. Whereas warmer upper colours allude to maximum bubble levels, indicating to investors that they should be more cautious.
The evolution of the Bitcoin Rainbow Chart
The Bitcoin Rainbow Chart has come a long way since it began. It initially showed up on the Bitcointalk forum in 2014 with the intention of providing an entertaining, yet informative, visual representation of Bitcoin’s price trends. Different people and companies have subsequently tailored this chart to be more precise and user-friendly through various adjustments over time.
Let’s dive into deeper detail about what made the original Bitcoin Rainbow Chart so special, as well as how its design has been altered throughout history!
Original Bitcoin Rainbow Chart
In 2014, an innovative way of showcasing the price movements and long-term trends of Bitcoin was presented by a user on Bitcointalk – this idea has come to be known as the original ‘Bitcoin Rainbow Chart’. This chart utilises a logarithmic growth curve that allows traders to quickly identify both buy and sell signals based on market sentiment.
The visual representation offered through the rainbow graph proved particularly popular amongst its viewers, giving insight into potentially profitable opportunities available in cryptocurrency trading.
Adaptations and improvements
The Bitcoin Rainbow Chart has become increasingly popular, inspiring various improvements and changes to the original. One of these adaptations is called the Rainbow Chart V2, a more up-to-date version containing data until 2022 and using an altered formula for accuracy.
These revisions have been beneficial in helping traders observe Bitcoin price trends as well as cryptocurrency markets associated with Bitcoin. The updated chart gives insight into current fluctuations, allowing users to understand them better than before thanks to its refined precision.
Using the Bitcoin Rainbow Chart for trading decisions
The Bitcoin Rainbow Chart can be a great way to spot possible investment openings in line with the current price range and market sentiment. It is important to remember that it should not stand alone, but rather used together with other forms of analysis for an all-round comprehension of what’s happening. How do we use this graph strategically?
Identifying buy/sell opportunities
The Bitcoin Rainbow Chart is a useful tool for traders looking to maximise their profits by analysing market sentiment and price movements over the long-term. By closely monitoring this chart, which uses colour bands to denote potential buying or selling opportunities, investors can make informed decisions on when it’s best to buy or sell. While it is effective in identifying trends related to longer-term price shifts, using the rainbow chart may not be ideal for those seeking more immediate gains. Other analysis tools such as TradingView are better suited for shorter term price indications.
Combining with other analysis tools
The Bitcoin Rainbow Chart is an excellent tool for observing market sentiment and long-term price movements. Traders can take advantage of this valuable resource by using it in conjunction with other analysis tools such as fundamental analysis, sentiment analysis, moving averages, trend lines, etc. This allows them to gain a comprehensive insight into the cryptocurrency markets before making any decision related to buying or selling. This kind of combined research will give traders a much better chance at making successful trades over time.
Limitations and criticisms of the Bitcoin Rainbow Chart
The Bitcoin Rainbow Chart is not without its drawbacks and critiques from traders. Critics contend that the colorful bands on this trading tool, which largely depend upon past records, do not provide a strong indication of what future price trends will be like.
Let’s analyse these criticisms in more detail to better understand them.
Arbitrary colour bands
The rainbow chart has been criticised for its lack of strict criteria applied to assigning the colour bands. As such, they may not reflect current market conditions or future price prospects accurately.
In spite of this criticism though, it continues to be favoured among many traders looking to gain an insight into their investment options using the rainbow colours as a guide.
Reliance on historical data
The Bitcoin Rainbow Chart is heavily reliant on past data which can provide valuable information about previous price activity and market trends. The chart may not be able to accurately predict the future due to unforeseen changes or unexpected events that could drastically affect the value of Bitcoin. Historical performance does not indicate future performance. Thus, it should always be used alongside other analysis methods in order for traders and investors to get a more comprehensive overview before making decisions in the cryptocurrency market.
Exploring other crypto rainbow charts
The Bitcoin Rainbow Chart is just one of the many different crypto rainbow charts available. There are other adaptations created specifically for Ethereum and various other cryptocurrencies. These specialised versions adhere to the same conventions found in the classic Bitcoin Rainbow chart, but are more tailored more precisely towards to each digital asset.
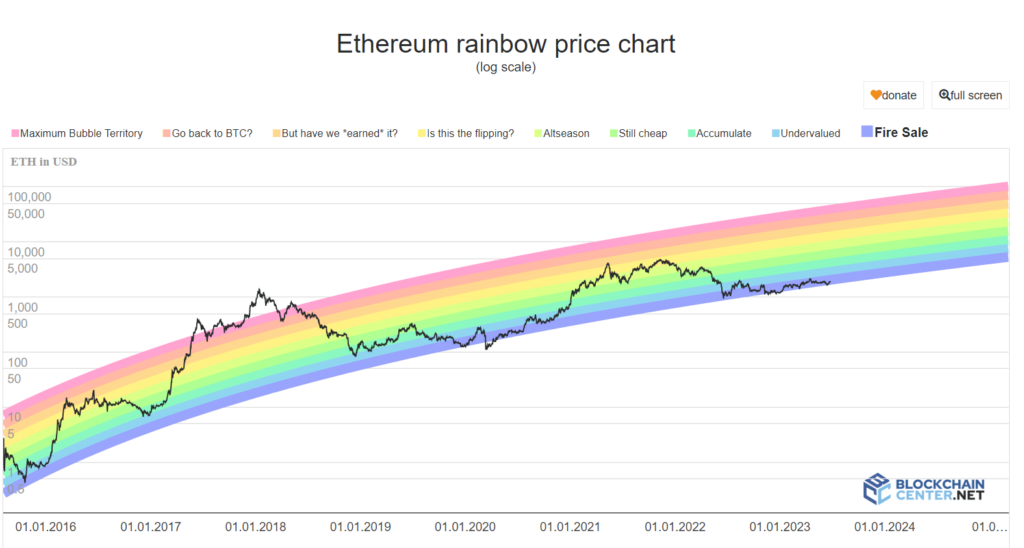
Ethereum Rainbow Chart
The Ethereum Rainbow Chart is based on the same formula as the Bitcoin Rainbow Chart and shows data from 2015. It utilises colour-coded bands to represent price levels and market sentiment, making it possible for traders to analyse trends in the price of Ethereum. It assists investors to identify potential buy/sell levels while keeping track of how investors feel about ETH’s performance over time.
Adapting the Rainbow Chart for other cryptocurrencies
The Rainbow Chart can be easily tweaked for other digital assets by simply altering the colour bands and market sentiment measurements to fit. This provides a clear picture of how different cryptos fare in the market, giving investors insight into advantageous times to buy or sell their holdings.
Summary
In summary, the Bitcoin Rainbow Chart is an attractive way to look at Bitcoin’s pricing history as well as market sentiment. Even with its critiques, traders can benefit from using the chart in conjunction with other technical analysis resources when making decisions about buying/selling Bitcoin. As digital currencies become more advanced over time, adaptations of the rainbow chart will continue to help investors better understand the sector and make more informed trading decisions.
Frequently asked questions
What is the Bitcoin Rainbow Chart?
The Bitcoin Rainbow Chart is a tool that gives a general overview of Bitcoin’s pricing behaviour over time. It utilises various coloured bands on top of a logarithmic growth curve channel and highlights different price ranges and market sentiment.
How can the Bitcoin Rainbow Chart help traders?
The Bitcoin Rainbow Chart is a valuable resource for traders that helps them find trade opportunities and track sentiment and cost ranges of the market. It can be used to point out potential buy/sell points or support/resistance levels. By using this tool, investors can observe trends in the market which can aid decisions while trading.
What are the limitations of the Bitcoin Rainbow Chart?
The main shortcoming of the Bitcoin Rainbow Chart lies in its inability to precisely forecast near-term price variations, as it only considers past data. Additionally, traders may have a hard time properly interpreting the chart due to the arbitrary hues used for each band.
Are there other crypto rainbow charts available?
Various crypto rainbow charts are available to explore, including an Ethereum Rainbow Chart. Modifications of these diagrams have been created specifically for analysing various digital currencies.