Key crypto indicators

Understanding the crypto market can feel overwhelming, but tools like the Bitcoin dominance chart, Fear and Greed Index, and crypto ETF (exchange-traded funds) inflows make it easier to spot trends. These indicators show how investors – from everyday traders to big institutions – are feeling about the market and where they’re putting their money. Whether it’s Bitcoin maintaining its dominance, the Fear and Greed Index signalling caution or excitement, or ETF inflows revealing institutional interest, these tools can help explain what’s driving the market and what might come next.
Bitcoin dominance charts
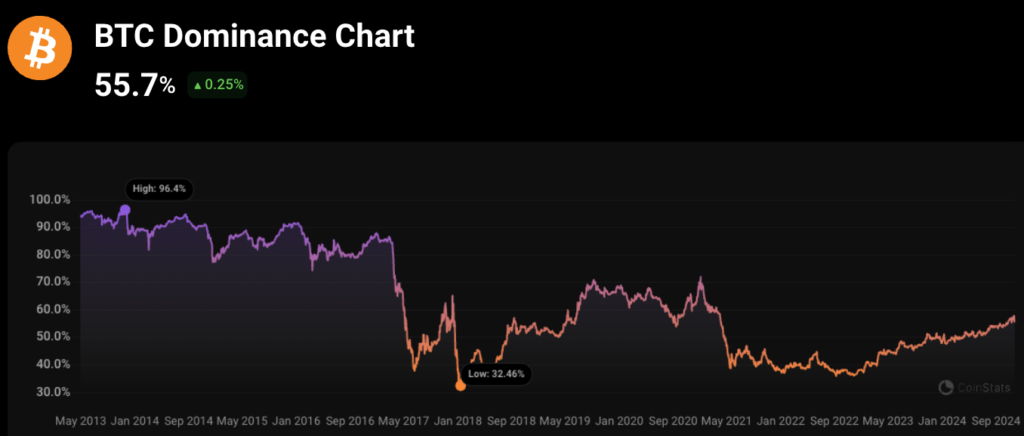
Source: Coinstats
What is the Bitcoin dominance chart?
The Bitcoin dominance chart shows how much of the total crypto market is made up of Bitcoin. For example, if the chart says 55%, that means Bitcoin makes up 55% of the market, and the other 45% is all the other cryptocurrencies combined (called altcoins – basically any crypto that isn’t Bitcoin, including Ethereum and Solana).
A high Bitcoin dominance typically signals caution among investors, with more focus on the most established cryptocurrency. A low dominance suggests a shift toward riskier alt coins, as investors seek potentially higher returns.
How does the Bitcoin dominance chart predict “alt coin season”?
When Bitcoin dominance drops during a rising market (a bull run), it often signals the start of “alt coin season”—a period where alt coins have historically seen rapid price gains. This usually happens as investors reinvest Bitcoin profits into alt coins, which can grow faster due to higher risk and potential rewards.
For example, after Bitcoin’s major price surge in 2020 (following a Bitcoin halving), the altcoin market grew by over 1,950%. Beyond Bitcoin’s performance, factors like how much money people have to invest, changes in regulations, and improvements in alt coin technology, also play a role in triggering these cycles.
By tracking Bitcoin dominance, investors can identify market trends and opportunities for alt coins. However, keep in mind that crypto markets are highly volatile, and past trends don’t guarantee future results.
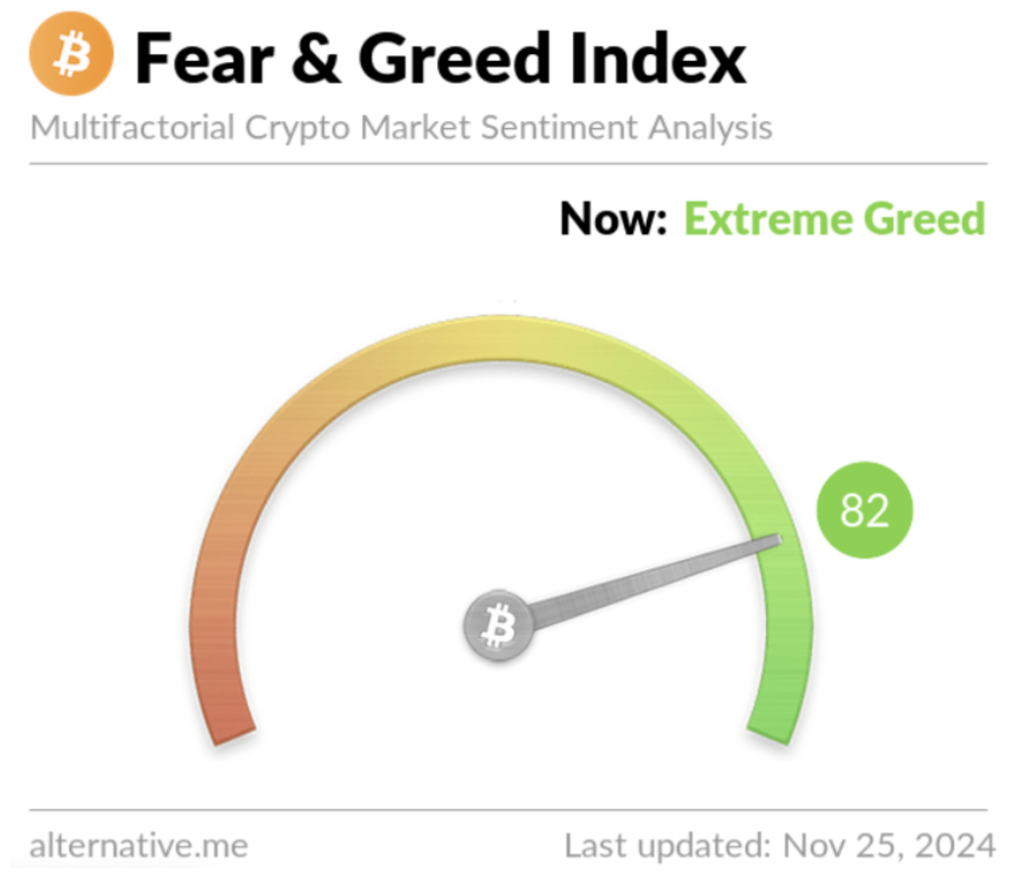
Fear and Greed Index explained
Another key crypto indicator to get across is the Fear and Greed Index, a tool used to gauge how people feel about the crypto market. It’s based around the idea that when investors are scared, prices usually drop. But when they’re overly greedy, prices often shoot up.
While timing the market is difficult, knowing the trend toward Fear or Greed alongside the Bitcoin dominance chart can help you make more informed decisions.
Crypto ETFs and big investors
Crypto exchange-traded funds (ETFs) make it easy for big investors like banks and corporations to invest in Bitcoin without owning it directly. These heavily regulated products are a popular way for institutions to enter the crypto market.
Tracking ETF inflows and outflows reveals how major players feel about the market. Steady inflows suggest confidence and a bullish trend. For example, when Wall Street rolled out its latest Bitcoin product, Bitcoin broke its (at the time) all-time high by 4% within 24 hours (roughly $144k at the time). Meanwhile, constant outflows may signal a downward market trend, helping you anticipate market shifts.
Summing up
The Bitcoin dominance chart, Fear and Greed Index, and crypto ETF activity give a clearer picture of in which direction the crypto world is moving. They help investors spot trends, understand shifts between Bitcoin and alt coins, and see how institutional players are influencing prices.
While these tools can’t predict the future, they’re valuable for making smarter decisions in the fast-changing world of crypto. Whether you’re diving into alt coin season or watching ETF inflows for clues, keeping an eye on these indicators is key to navigating the market.
Remember past performance does not predict future success, always do your own research, and only invest what you’re able to lose.